Logger
When you develop a system, you need something monitoring that. When a trouble comes up you need a track to figure out what happened. The logging is an important part of this investigation. Why not use System.out? Because it's not enough.
Using logging you have, for example, different levels (such ERROR, WARN, INFO, DEBUG), you can create files to store the log information and many other resources to help you to have information about what the applications are really doing.
You can find two main frameworks to execute that activity: Log4J and Logback. Both of them were created by the same author, Ceki Gülcü.
Logback is the successor of the Log4J. They implement SLF4J, a set of common logging interfaces used by the Java community. Such as a successor should be, Logback brings advantages over Log4J.
- The Logback is faster then log4j,
- Native support for slf4j, which reduce the overhead
- Extensive documentation
- Configuration files in XML or Groovy
- Automatic reloading of configuration files
- Graceful recovery from I/O failures
- Automatic removal of old log archives
- Automatic compression of archived log files
- Multiple FileAppender instances can write to the same log file
- A wide array of Filter
- It integrates with Servlet containers such as Jetty or Tomcat
If you believe on these advantages and would like to switch the technology you just need to update the dependence on pom.xml, to change the log file from log4j.xml to logback.xml and put on resource folder. A short post about this you can find here.
In SpringBoot, the Logback is already configured with default settings.
Architecture
Logback architecture has three important modules:
- logback-core – the central part that gives support to the other modules. It contains the basic logging functionality
- logback-classic – it extends the core module and contains additional logging improvements. It´s here where are most of the improvement of log4j.
- logback-access – provides integration with servlet containers, such as Tomcat and Jetty, to provide HTTP-access log functionality
There are three main classes of Logback that will help developers to log messages according to message type and level, and to control at runtime how these messages are formatted and where they are reported:
- Logger: it is part of logback-classic and it is the class that applications interact with to create log messages. They capture the logging data and output it to a destination using appenders. The Loggers are named entities and they are attached to a LoggerContext which is responsible for manufacturing loggers and arranging them in a tree such a hierarchy. The levels to logger are: Trace < debug < info < warn < error. If you set the logger level to WARN, then only the WARN and ERROR level log messages will be displayed and the rest will be ignored.
- Appender: it is part of logback-core and it is who place log messages in their final destinations. It´s possible to have more than one Appender. Multiple Appenders can be combined to write the same log event to multiple destinations.
- Layout: it is also part of logback-core. It class, used by appenders, prepares messages for outputting, transforming a log event to a string. The formats can be customized.
Then, (1) the instance of the logger is retrieved, (2) a LoggingEvent is created with relevant parameters, and (3) invoke the doAppend() methods of all the applicable appenders. To retrieve the logger instance is used the getLogger method from org.slf4j.LoggerFactory class. And the relevant parameters in LoggingEvent are:
- the logger of the request,
- the request level,
- the message itself,
- the exception that might have been passed along with the request,
- the current time,
- the current thread,
- various data about the class that issued the logging request
- the MDC: The MDC is used to decorate the logging request with additional contextual information. It is implemented by logback-classic.
MDC
It's possible that your application is multithread. A technique used to manage these threads is to have one log request by a client. To achieve this target the user puts contextual information (client id, request parameters, etc) into the MDC (Mapped Diagnostic Context). The methods put and get affect only the MDC of the current thread and its children. Each thread has its own copy of the MDC. Also, usually is recommended that each put operations has a corresponding remove operation to avoid the MDC contains a stale value for some keys. Add the remove method on finally block is a good strategy, but it is not an obligation.
Unfortunately, working on a web application, just use the strategy to use remove method after a put method cannot be enough. It's possible that be lead false information in MDC. One approach to have consistency on the MDC is to store the information at the beginning of the process and remove it at the end of the process. And who can help us on this is the servlet Filter where you can use the doFilter method to retrieve the relevant data from the request or cookie and store that in the MDC.
Config
The requirement to use the logger is to have the dependence configured. If you use maven, you need to add the dependency.
<dependency>
    <groupId>org.slf4j</groupId>
    <artifactId>slf4j-api</artifactId>
    <version>1.7.7</version>
</dependency>

<dependency>
    <groupId>ch.qos.logback</groupId>
    <artifactId>logback-classic</artifactId>
    <version>1.1.2</version>
</dependency>

<dependency>
    <groupId>ch.qos.logback</groupId>
    <artifactId>logback-core</artifactId>
    <version>1.1.2</version>
</dependency>
Now, to track your application you need to create an instance in the class you wish to monitor using the factory and use this in the code.
import org.slf4j.Logger;
import org.slf4j.LoggerFactory;

public class BasicConfigApp {
   final static Logger logger = LoggerFactory
                         .getLogger(BasicConfigApp.class);
   public static void main(String[] args) {
       logger.info("Msg INFO");
       logger.warn("Msg WARN");
       logger.error("Msg ERROR");
       logger.debug("Msg DEBUG");
   }
}
The result is shown below.
09:29:15.272 [main] INFO p.l.BasicConfigApp - Msg INFO
09:29:15.276 [main] WARN p.l.BasicConfigApp - Msg WARN
09:29:15.276 [main] ERROR p.l.BasicConfigApp - Msg ERROR
09:29:15.276 [main] DEBUG p.l.BasicConfigApp - Msg DEBUG
You also should create a configuration file to logback. It can be using XML or Groovy. The sequence used by Logback to find this file is (1) search for logback-test.xml, if it cannot find, then (2) the Logback will search for logback.groovy, if it cannot find this other file so the Logback will (3) search for logback.xml. If none is found, (4) Logback will use the BasicConfigurator with default logging functionality.
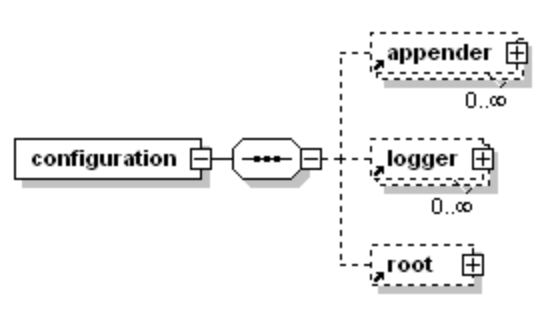
One basic example is using the ConsoleAppender with the PatternLayout, displaying at the level DEBUG or below. Using the scan property "true" will possibility to automatically reload configuration files when they’re modified.
<configuration scan="true">
    <appender name="STDOUT" class="ch.qos.logback.core.ConsoleAppender">
        <encoder>
            <pattern>%d{HH:mm:ss.SSS} [%thread] %-5level %logger{50} - %msg%n</pattern>
        </encoder>
    </appender>
    <root level="debug">
        <appender-ref ref="STDOUT" />
    </root>
</configuration>
To the layout, you can use also PatternLayoutEncoder, LayoutWrappingEncoder or HTMLLayout.
The notation to the layout:
- %d - outputs the time which the log message occurred in formats that SimpleDateFormat allows.
- %thread - outputs the name generating the log message.
- $-5level - outputs the logging event level of the log message.
- %logger{36} - logger name represented by the package + class name the log message occurred in. The number inside the brackets represents the maximum length of the package + class name. This case truncated to 35 characters.
- %M - the name of the method that the log message occurred in.
- %msg - outputs the actual log message.
- %n - line break
- %green() - sets the colour of the output contained in the brackets to green(other colours are available).
- %highlight() - sets the colour of the output contained in the brackets to the depending on the logging level (for example ERROR = red).
If you need to store the log in a file, you can use the FileAppender (RollingFileAppender – extends the FileAppender with the ability to roll over log files).
<appender name="rollingFile" class="ch.qos.logback.core.rolling.RollingFileAppender">
    <rollingPolicy class="ch.qos.logback.core.rolling.TimeBasedRollingPolicy">
        <fileNamePattern>log-%d{yyyy-MM-dd}.log</fileNamePattern>
        <maxHistory>30</maxHistory>
        <totalSizeCap>3GB</totalSizeCap>
    </rollingPolicy>
    <triggeringPolicy class="ch.qos.logback.core.rolling.SizeBasedTriggeringPolicy">
        <maxFileSize>3MB</maxFileSize>
    </triggeringPolicy>
    <encoder>
        <pattern>[%thread] %-5level %logger{36} - %msg%n</pattern>
    </encoder>
</appender>
To send log by email you can use SMTPAppender. To storage in databse, you should use DBAppender.
Also, you can filter what will be loaded using LevelFilter, ThresholdFilter and EvaluatorFilter.
Example
I based the example on this post. The code you can find on my GitHub.
In a basic way to log, also you can add information on MDC. You just need to add the MDC code.
// Code to be added
MDC.put("userRole", "ADMIN");
logger.info("Admin Action");

//output on console
09:32:37.447 [main] INFO  userRole=ADMIN p.l.BasicConfigApp - Admin Action
But, if you need a complex solution, you should use the logback file. To test, you can see the code below that call a second class (LogbackControlBean) inside of another package, “bean”. It will be setter in xml to filter the log.
package pt.logback;

import org.slf4j.Logger;
import org.slf4j.LoggerFactory;
import pt.logback.bean.LogbackControlBean;

public class App {
   private static final Logger logger = LoggerFactory.getLogger(App.class);
   public static void main(String[] args) {
      LogbackControlBean bean = new LogbackControlBean();
      bean.init();
      logger.debug("Debug init process...");
   }
}
The App class use one debug and the LogbackControlBean class do the info and debug. Because of it inside the bean package configured to be filtered in XML, only one of them will be shown on the console.
package pt.logback.bean;

import org.slf4j.Logger;
import org.slf4j.LoggerFactory;

public class LogbackControlBean {

    private static final Logger logger = LoggerFactory
                       .getLogger(LogbackControlBean.class);
    public void init() {
       String msg = "Init test.";
       logger.info("Info Process: {}", msg);
       logger.debug("Debugging message");
    }
}
The configuration responsible to filter the log and print on console and create a file to store the logs is inside of the logback.xml showed below. Usually, this file should be on the resources folder.
<configuration>
  <!-- Send debug messages to System.out -->
  <appender name="STDOUT" class="ch.qos.logback.core.ConsoleAppender">
    <!-- By default, encoders are assigned the type ch.qos.logback.classic.encoder.PatternLayoutEncoder -->
    <encoder>
          <pattern>%d{HH:mm:ss.SSS} [%thread] %-5level %mdc %logger{5} - %msg%n</pattern>
     </encoder>
  </appender>

  <!-- Send debug messages to a file at "loggerStudy.log" -->
  <appender name="FILE" class="ch.qos.logback.core.rolling.RollingFileAppender">
    <file>loggerStudy.log</file>
    <encoder class="ch.qos.logback.classic.encoder.PatternLayoutEncoder">
      <Pattern>%d{yyyy-MM-dd_HH:mm:ss.SSS} [%thread] %-5level %logger{36} - %msg%n</Pattern>
    </encoder>

    <rollingPolicy class="ch.qos.logback.core.rolling.FixedWindowRollingPolicy">
      <FileNamePattern>loggerStudy.%i.log.zip</FileNamePattern>
      <MinIndex>1</MinIndex>
      <MaxIndex>10</MaxIndex>
    </rollingPolicy>

    <triggeringPolicy class="ch.qos.logback.core.rolling.SizeBasedTriggeringPolicy">
       <MaxFileSize>2MB</MaxFileSize>
    </triggeringPolicy>
  </appender>

  <!-- handles classes logging in the package -->
  <logger name="pt.logback.bean" level="INFO" additivity="false">
    <appender-ref ref="STDOUT" />
    <appender-ref ref="FILE" />
  </logger>

  <!-- handles logging in all of the classes that are not in the package -->
  <!-- By default, the level of the root level is set to DEBUG -->
  <root level="DEBUG">
    <appender-ref ref="STDOUT" />
  </root>
</configuration>
Performance
You can see in the FAQ from SLF4J the topic What is the fastest way of (not) logging?. It demonstrate the best way to log the code with focus on performance.
The usual way is to verify the level then log the code as you can see below. One point to pay attention to is this conditional use process to validate the conditional. It's good because avoid process data will not be used if the level is not validated but when is not the level you use process is unnecessary.
if(logger.isDebugEnabled()) {
  logger.debug("Entry number: " + i + " is " + String.valueOf(entry[i]));
}
The indication is to use directly the SLF4J resource that improves the performance. The way shown below let the library decide the process. The data will only be processed if is in the correct level.
logger.debug("The new entry is {}.", entry);If the parameter is an object, the library will use to toString() method from that object.
PS: The codes were taken from SLF4J’s FAQ.
REFERENCES:
- https://www.baeldung.com/logback
- https://stackify.com/logging-logback/
- https://dzone.com/articles/logback-introduction
- https://examples.javacodegeeks.com/enterprise-java/logback/logback-configuration-example/
- https://www.oodlestechnologies.com/blogs/Brief-About-Logback-And-How-It-Works/
- https://logback.qos.ch/manual/
- https://www.codingame.com/playgrounds/4497/configuring-logback-with-spring-boot
- https://www.stubbornjava.com/posts/logging-in-java-with-slf4j-and-logback
- http://slf4j.org/faq.html#logging_performance